This week the #puzzle is: Can You Squeeze the Bubbles? #circles #geometry #area #minimize (Link at the bottom.)
| Draw a unit circle (i.e., a circle with radius 1). Then draw another unit circle whose center is not inside the first one. Then draw a third unit circle whose center is not inside either of the first two. |
| Keep doing this until you have drawn a total of seven circles. What is the minimum possible area of the region that’s inside at least one of the circles? |
And for extra credit:
| Instead of seven unit circles, now suppose you draw N of them. As before, the center of each new circle you draw cannot be inside any of the previous circles. |
| As N gets very, very large, what is the minimum possible area of the region inside at least one circle in terms of N? |

But first. Last week I made a booboo. At some point I began trusting my assumption about the probabilities so much, that I didn’t figure out, why my monte carlo results didn’t line up. This again lead to me saying 2 was the correct answer to the extra credit, when in fact… well, as I said, my monte carlo said something else. Something better. This is a detail from my heat map 5.
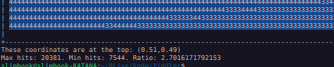
The lowest values occur, not in the corner (4), but towards the middle of the side (3). And the ratio is something like 2.7. Earlier heat maps actually showed this more clearly. Here’s the 3d image based on my monte carlo data, and for comparison the other 3d image again:
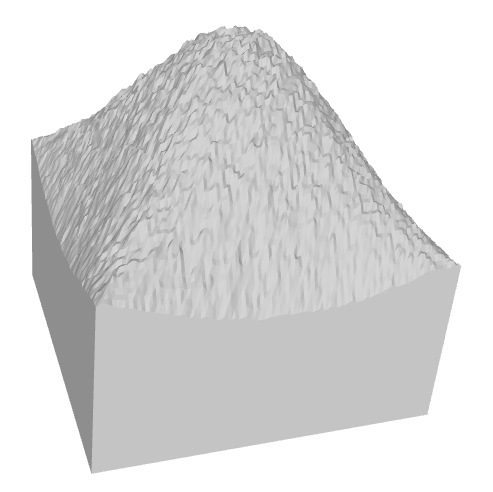
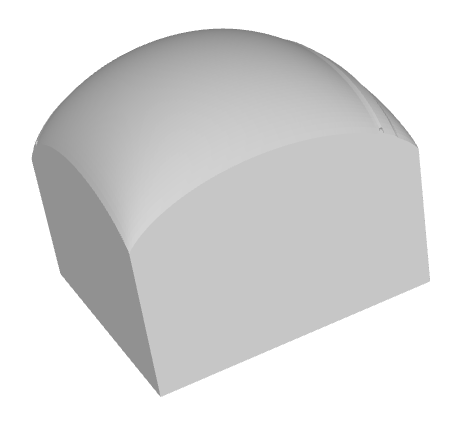
The important feature is that there’s a dip along the lower edge. Corner low, middle of side lower. Sigh. Anyway. Back to the puzzles from this week.
Highlight to reveal (possibly incorrect) solution:
Desmos live ![]() Two Circles Calculator
Two Circles Calculator ![]() Desmos image
Desmos image
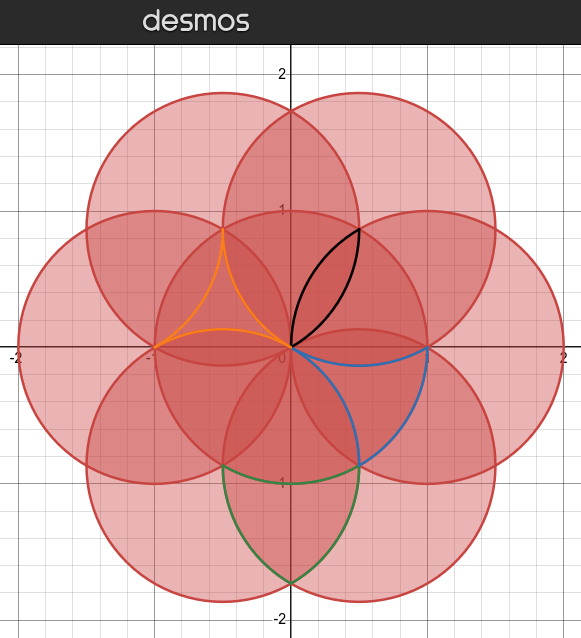
So, here’s the big assumption: The best possible choice for the next center is to tuck it as far into the previous circle(s) as possible. 2nd center goes on the periphery of the 1st. 3rd center goes where the 2 first circles cross each other, into the little “fjord”. Etc. See model on Desmos.
(This is among other things assuming, that being on the periphery, being a distance of 1 from the center, isn’t being inside the circle.)
The next question then is: What is the area of this figure? Looking at the image, we have 7 circles. But then we have to subtract 6 green figures, so as not to double count. And 6 blue figures twice. And 6 black figures 3 times. (Also note, 1 green figure = 1 orange figure + 2 black figures; 1 blue figure = 1 orange figure + 1 black figure.)
Area of circle: π 1² = π = 3.14159.
Area of overlap between 2 circles, like the middle circle and the one to the right of it – this is also 2 orange figures and 5 black figures: From Two Circles Calculator, 1.22837.
Area of black figure: From Two Circles Calculator, 0.18122.
Area of orange figure: (1.22837 – 5 * 0.18122) / 2 = 0.161135.
Area of blue figure: 0.161135 + 0.18122 = 0.342355.
Area of green figure: 0.161135 + 2 * 0.18122 = 0.523575.
Area of the whole figure: 7 * 3.14159 – 6 * 0.523575 – 2 * 6 * 0.342355 – 3 * 6 * 0.18122 = 11.479.
And for extra credit:
It’s actually easier to look at hexagons and triangles. Each hexagon consists of 6 triangles. Each triangle is actually part of 3 hexagons. Therefore adding 1 hexagon only contributes 6/3 = 2 new triangles.
The area of such 2 triangles is √ 0.75 = 0.8660. The function f(N) is therefore 0.866 * N.
Test: Going from 7 circles in the above fiddler to 19 (in a symmetrical way) adds 12 circles. The area grows by 3 orange figures and 5 black figures for each new circle “on a corner” and 2 orange figures and 3 black figures for each new circle “on an edge”. This is on average 2.5 * 0.161135 + 4 * 0.18122 = 1.1277175. As N goes up, the edge circles will dominate. An edge circle contributes 2 * 0.161135 + 3 * 0.18122 = 0.86593. QED.
***
