This week the #puzzle is: Can You Weave the Web? #geometry #trigonometry #probability (Link at the bottom.)
| A spider weaves a web within a unit square (i.e., a square with side length 1) in the following haphazard manner: |
| First, the spider picks two points at random inside the square. In particular, it picks the points “uniformly,” meaning any point is equally likely to be picked as any other point. |
| Next, the spider connects the two points with a strand of silk and extends the strand to two sides of the square. For example, here is a web made of 10 silk strands that were picked as described: |
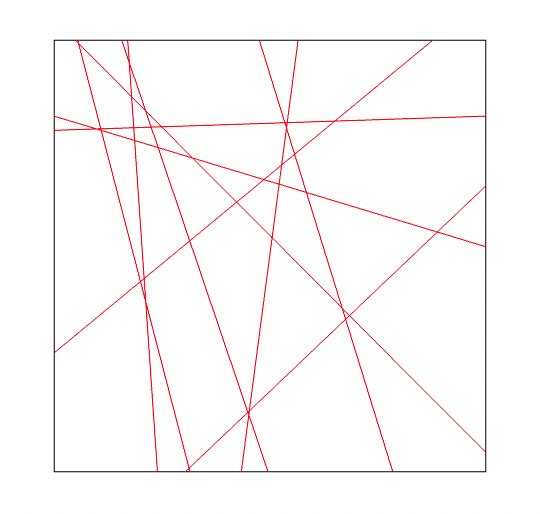 |
| Within the unit square, which point (or points) is most likely to be on a new strand of silk, whose two defining points have not yet been picked? |
| (While the probability that any specific point winds up being precisely on the new strand is zero, some points and regions are nevertheless more likely to be on the strand than others.) |
And for extra credit:
| As we just acknowledged, there exists a point (or points) in the unit square that is more likely than any others to be on the randomly selected silk strand. |
| At the same time, there exists a point (or points) in the unit square that is less likely than any others to be on the random strand. |
| How much more likely is a most likely point to be on the strand than a least likely point? More specifically, suppose the maximum of the probability density for being on the strand is pmax and the minimum probability density is pmin. What is the ratio pmax/pmin? |

Highlight to reveal (possibly incorrect) solution:
Program 1 ![]() Program 2
Program 2 ![]() Desmos
Desmos ![]() Heat map 1, 2, 3, 4, 5, 6. 3d image.
Heat map 1, 2, 3, 4, 5, 6. 3d image.
Okay, this was a tough one.
The main realization here is: Given the 2 points, the longer the line segment within the square is, the higher the number of points on the segment. So, for any given point I can ask, what lengths of line segments do we have, systematically going all the way around the point? This can again be changed to, what is the distance to the square going all away around the point? The longer the sum of the lengths of the segments, the higher the probability a given point was hit. The sum of the lengths evolves in an area.
The area only tells me something about the probabilities compared to each other! I don’t actually calculate any probabilities directly.
For the fiddler, Desmos just supplied a picture of what was going on. For extra credit I got some useful numbers. I construct a graph for “what is the distance between this point and the square, in all possible directions”. Then I calculate the area under the graph for one turn around the possible angles. Experimentation shows, the area is somewhere between 1.76274717407 and 3.52549434808. (Feel free to play around with model.) The max seems to be right in the middle of the square, and the min in the corners.
In order to be sure of my numbers I use the monte carlo method in program 1. Construct a lot of lines. For each line, note which parts of the square it goes through. (I have subdivided the square into smaller squares.) Again, I get the same max and min positions, and it points towards the middle and the corners of the square.
Finally in program 2 I use the integral method to calculate (more) exact numbers. Max is in smack dab (0.5, 0.5).
As max I get 3.5254943481 and as min 1.7627475763. The ratio is 1 / 0.5000001141 = 1.999999544. I feel pretty confident saying it is actually 2.000. The Desmos numbers confirm this.
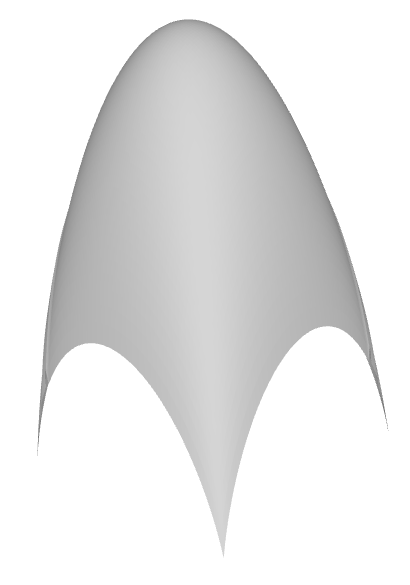
I also constructed some fun heat maps of the situation, and a 3d image. And one of my programs hates the number 14?
***
